FarmIT 3000 - Grazing
Farm IT Help - Grazing
Grazing
For some schemes there is a requirement to record the grazing activity on a field as this will affect factors such as nutrient levels.
FarmIT 3000 provides the means to record the grazing on a field by creating a field movement record, identifying the date and number of animals moved either in or out of the field. You may look on these as local movements if you wish.
You may record a grazing record from the field grazing tab, and specify the exact ear tag numbers of animals moved in or out. As you may find this rather teadious and difficult to maintain we have also provide the ability to create movement/grazing record automically when you change the location of a management group. See Management Groups for more information.
To enter grazing activity open the field record for the field or field part concerned and click on the 'Grazing' tab on the top of the field record.
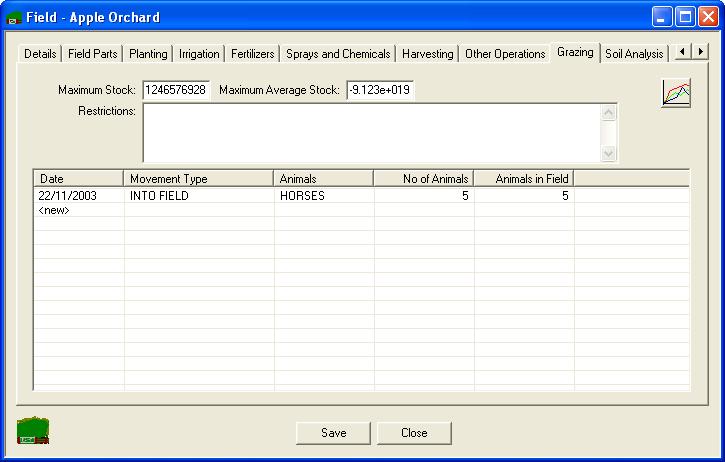
There is room above the list of grazing entries to write any notes about restrictions on that field, such as time restrictions required by environmental schemes. Having the information here makes it easy to remember and easy for any inspectors to see that you know your restrictions and are complying with them.
To add a new entry simply double click the '<new>' at the bottom of the list and fill in the details.
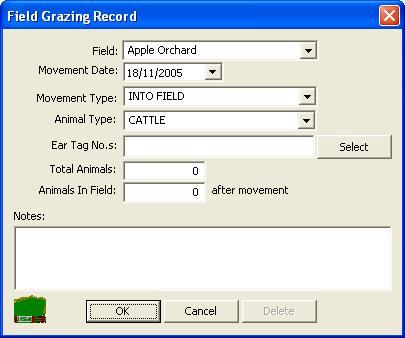
Clicking the 'Select' button will open the 'Multiple Animal Selection' box from which you can choose a number of animals from those entered in your stock records.
Click 'OK' and these details will be added to the list in the field record.
For a simple graphical view of the grazing activity of the field over time just click on the graph item on the top right corner of this window.

This will result in a line graph being drawn showing the number of animals in the field over time. Different animal types will be shown in different colours and will be marked in the key below the graph. If you hover the mouse over one of the small crosses it will bring up a tool tip which gives the detail of that entry.
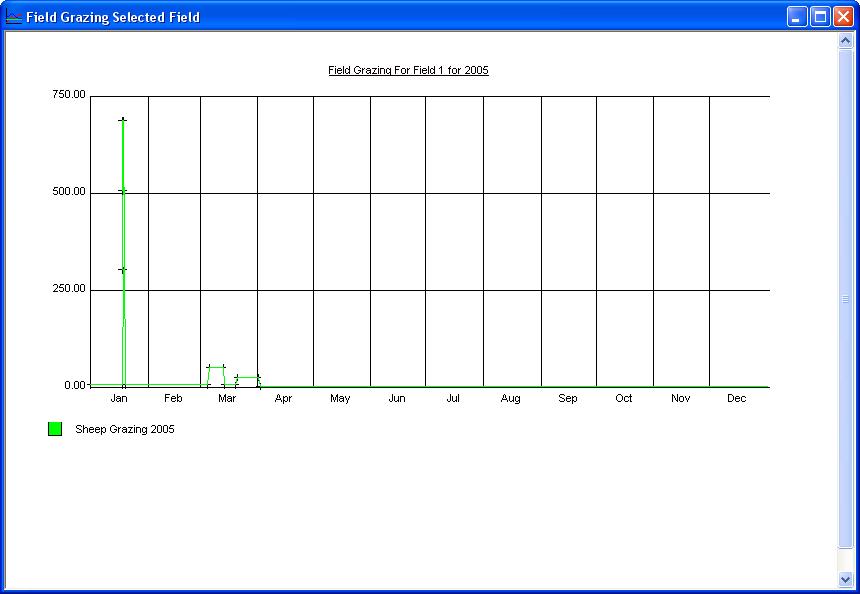
Drawing the graph from the field record will only allow show the most recent year of activity. If you wish to choose previous year to graph you must access the information in a slightly different way. See Individual Field Stocking Levels.
As with all the graphs in this software you can soom in on the graph by holding down the Control 'Ctrl' key and click the + key on the number pad of your key board. Do the same but with the - key instead to zoom out. Reposition the graph on the screen by using the scroll bars.