Farm IT Help - Stock Weight Analysis - Graphs.
Stock Weight Analysis - Graphs.
The weight analysis tool allows you to simply
select animals and analyse the weight measurement. (see Stock Weight Analysis)
From this window you may also
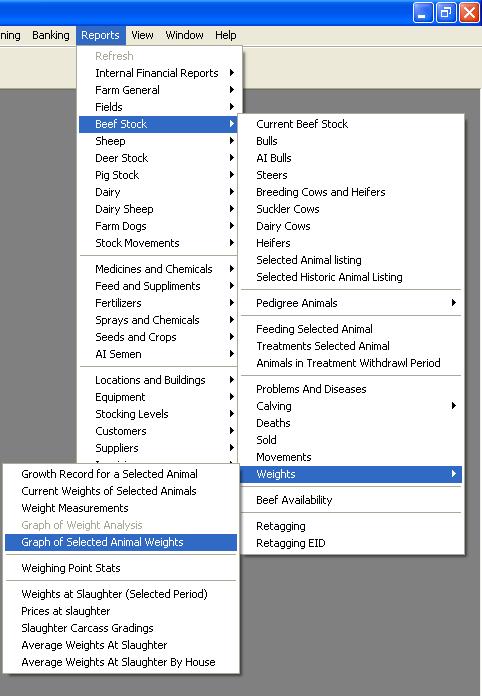
graph the weights of the selected animals. You may also select animals to graph
by selecting the 'Graph Selected Animals' option from the reports menu for
cattle or sheep weights.

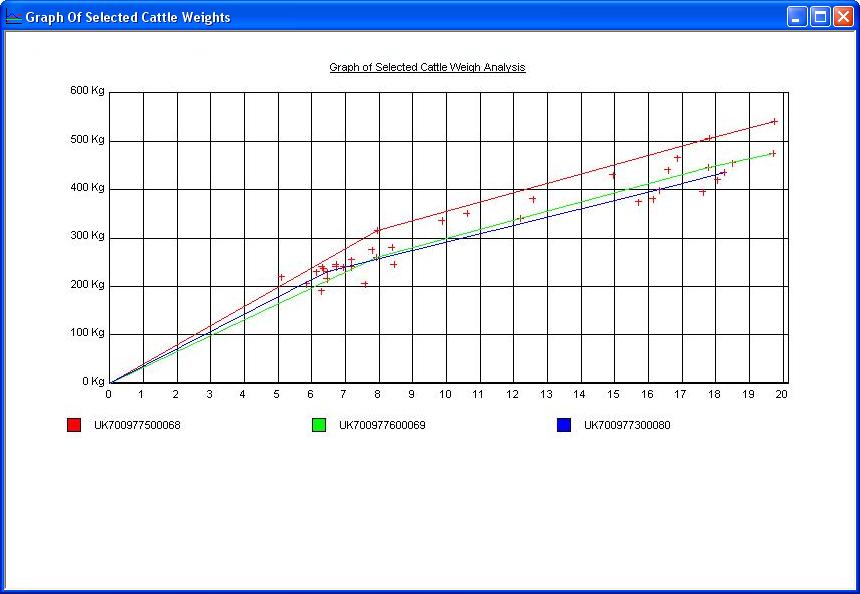
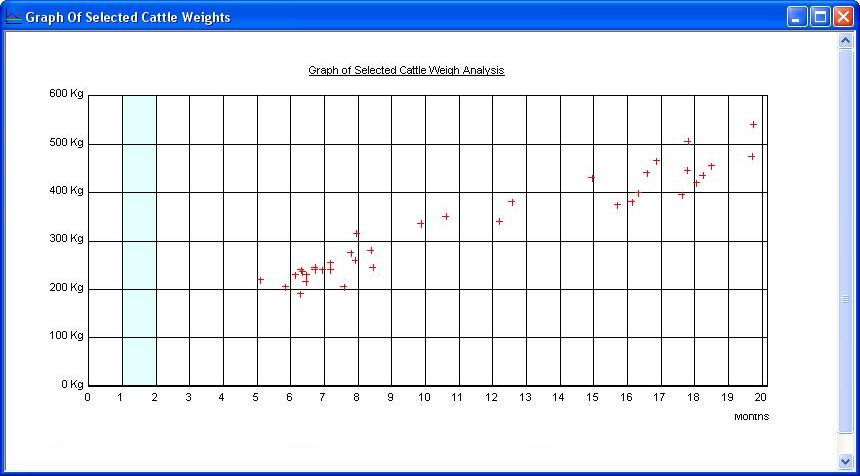
The following example shows weights for a group of selected
steers.

The weights are displayed based on the age of
the animal, not the weigh date. Thus allowing you to plot multiple animals and
compare weights. The animals age is displayed in approximate months
across the bottom (months = 30 Days).
You may identify the animal by placing you
mouse over the cross. The animals identity is then displayed as a tool tip. The
details refer to the cross which is nearest to the point of
the cursor - this arrow cursor will change to a magnifying glass as it passes
over a point. If you double click your left mouse button when the cursor has changed to a magnifying
glass it will bring up the full record for that animal.
You may also select an individual animal and add a full trace
linking the weight data for the selected animal. Place the mouse over the weight
point and right click to bring up the menu. Now simply select the 'Add Selected
Animal trace' option.

The selected animal trace will be added and
the ear tag number identified in the key. You may select up to ten animals in this way. If you choose ten animals or less via
the animal selection criteria the traces will be added to the graph automatically.

You can zoom in on any graph by holding down the control key
('Ctrl') on your keyboard and clicking the + sign on the number pad of your
keyboard at the same time. Use the scoll bars to reposition the graph within the
window to view the part of interest. You can zoom back out with the
control key and the - sign.
To print the graph simply click the print button on the toolbar or
select print from the file menu.