Lambing Graphed by the Day.
Just in case you need reminding of how many nights you were up
lambing or in case next year you want to book a holiday, the graph of lambing
will show you exactly when the events occurred.
Available on the 'Ewe Lambing (detail)' menu found via
the 'Sheep' section of the 'Report' menu is the 'Graph of Lambing'.
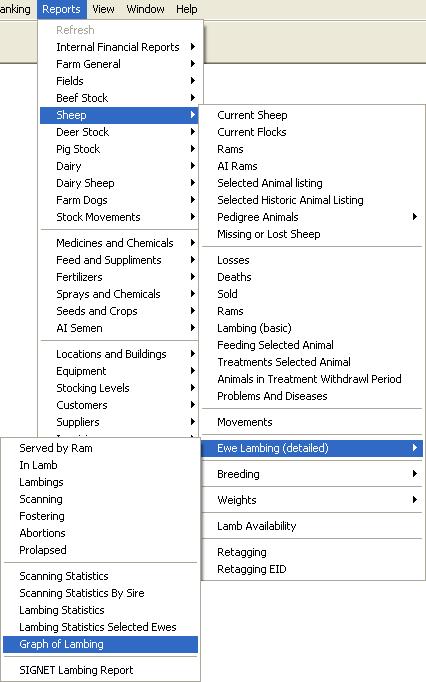
You will be prompted to select a year for the graph (2004 was
chosen for the graph below). Obviously only data that has been entered will
show on the graph. If there is no lambing data available for a particular year
the trace on the resulting graph will run flat along the bottom.
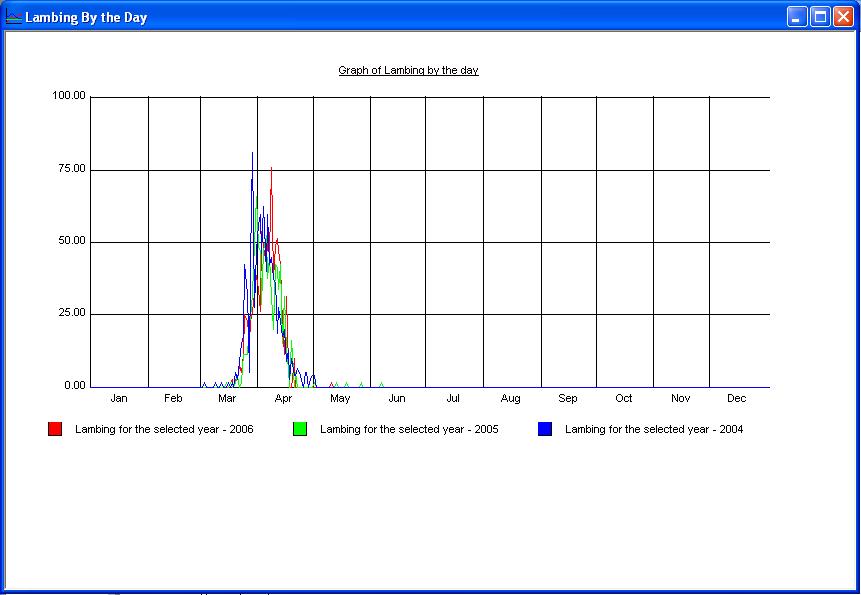
You may add aditional traces by right clicking the graph
and selecting the 'Add Trace' option. This will add a trace in a different
colour for the year you then choose.
You can zoom in on any graph by holding down the control key
('Ctrl') on your keyboard and clicking the + sign on the number pad of your
keyboard at the same time. Use the scoll bars to reposition the graph within the
window to view the part of interest. You can zoom back out with the
control key and the - sign.