FarmIT 3000 - Farm Maps
Farm IT Help - Farm Maps
Farm Maps
Farm maps provide a graphic view of your farm, you may then use the graphic view
to select fields and add field records, show field data or even create grazing
records by drag and dropping cows and sheep.
Custom Maps and Google Maps
FarmIT 3000 provides TWO (YES! - 2) ways of mapping your farm, traditionally this was based on our our custom mapping interface based on a backgroud "image" of your farm, for example a scanned map. However with the growth in GPS and online maps this has been rather overtaken. So in 2020 we decided to embedded a GOOGLE maps interface into FarmIT 3000, FarmIT Online and FarmIT Mobile for Android. with the result that you can now use google maps and GPS data to produce maps of your farm within the FarmIT 3000 software and link the map to your field records.
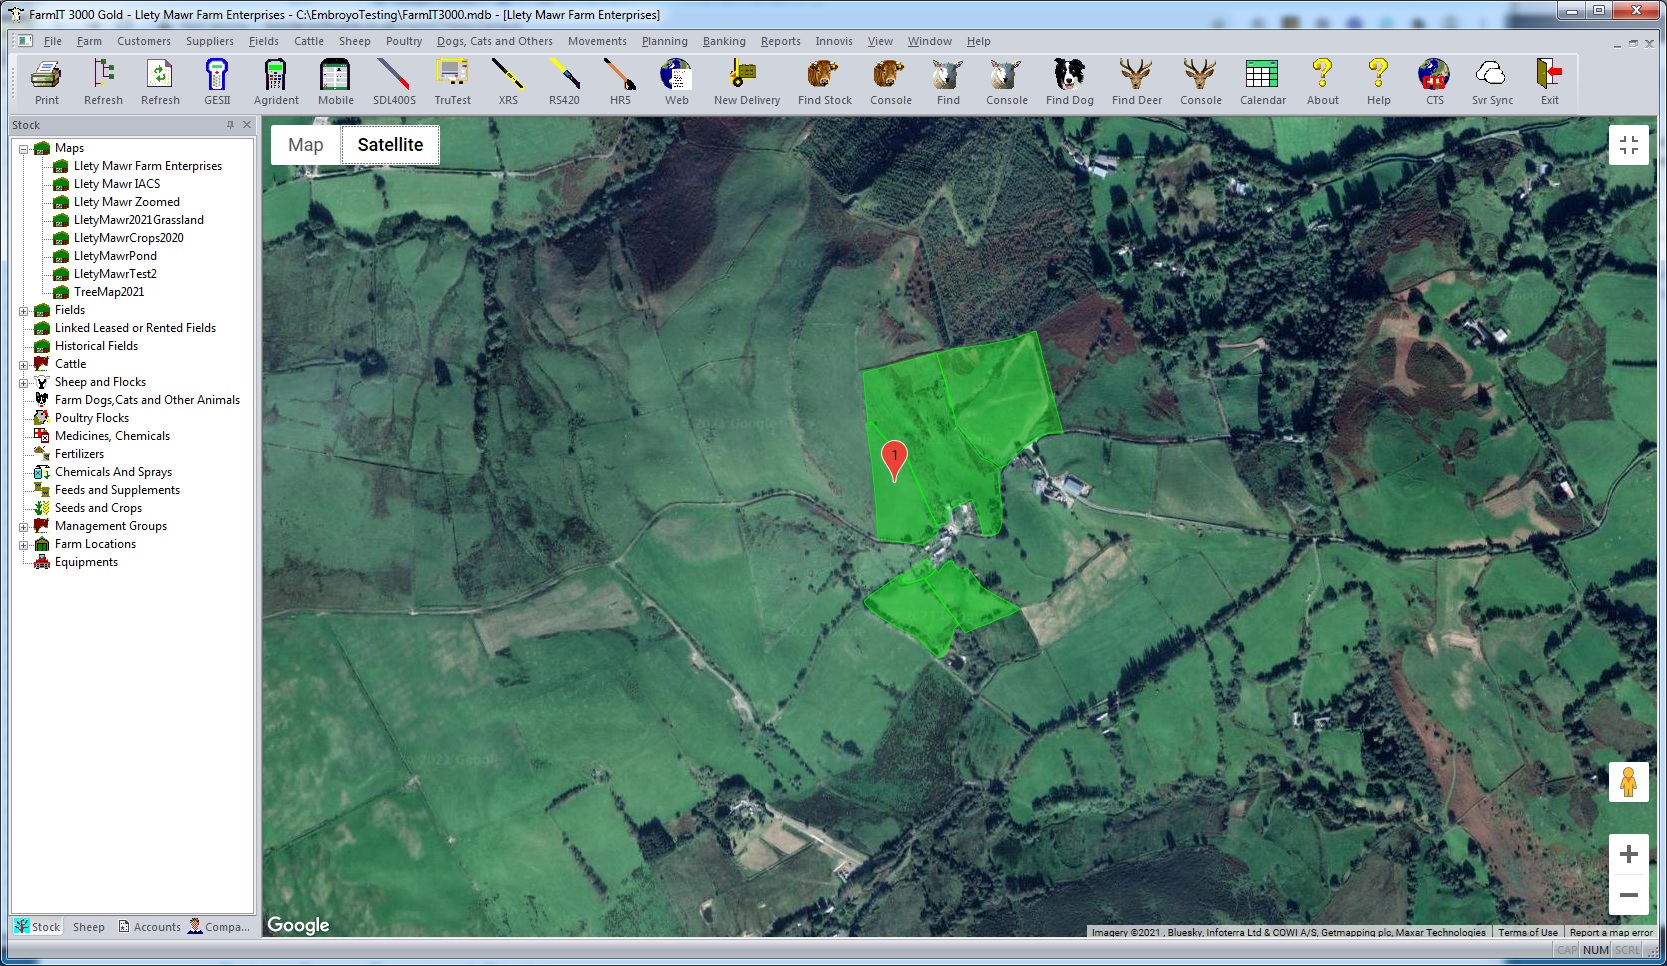
Google Maps
Google maps are driven by Latitude and Latitude data, normally produced by GPS, however you can also edit a google map and draw field boundries, Lines and place markers. So your can plot fields, field parts, lakes, bogs, draw fence lines, water pipes and add makers for gates, cairns, trees and alike. You can even use your android GPS phone with FarmIT Mobile to mark the coordinates whilst actually in the field for real!. So GOOGLE maps has many advantages over our traditional software. However there is one advantage that is thank's to the RPA in England and that is the RPA Land Parcels website, where if you have a SBI number you can download your fields and GPS data. Importing this data means you can create all your fields and plot them on google maps within minutes!
Custom Maps
For a custom map all you need to do is to scan your
map, be it a drawing, official farm map, arial photograph, plan etc, save
it as a windows bitmap and you may then plot your fields onto your map.
Border Software will even do this for you! (for a small administration fee).
You may actually use any map or picture you wish as the background, allowing you
to use maps of any scale for example your IACS maps or even arial
photos. Once you have a background map you can then overlay other information on
the map and link fields and field boundries to the map. Once the fields
areas are in place you can then colour the fields with crop data or field plate
readings.
Once a map is created, you may also edit it and save the result as another map,
enabling you to produce a map of planting or harvesting for each year or
season. You may also add labels to the maps, draw land management symbols,
identify key features etc, etc. Finally you may print out the result, and use
it on the ground, for yourself or your contractors.
The following example shows a IACS map with plotted symbols for entry level
stewardship.

The following sample shows an arial photo with field boundries and linked
fields. Once created and fields entered you may then simply click on the field
name to bring up the field details. You may also zoom in and print your map.
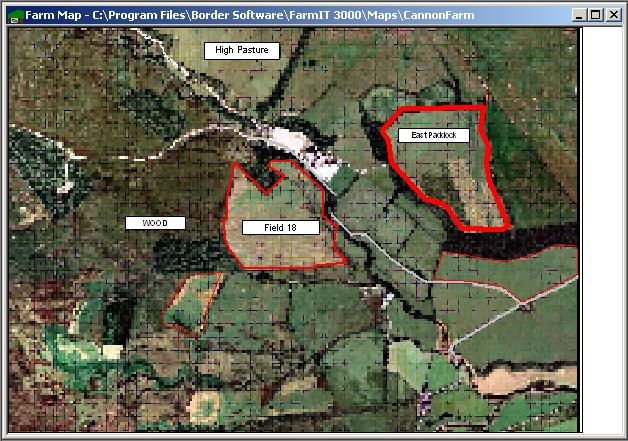
Typical Farm Map
You can zoom in on the map by right clicking and selecting the zoom
option from the resulting menu or by holding down the control (Ctrl) key
and clicking the + or - buttons on your keyboard.