Analysis Views - Much more flexiable than just reports
FarmIT 3000 provides a wide range of reporting and analysis views. Analysis
views differ from the fixed reports in the fact that you may actually choose
from a wider range of available column headers to meet your own specific
requirements. You may then sort the data by simply clicking on a column
header and print or export the data.
Analysis view are found under the main Cattle, Sheep, Deer and Pigs main menu...for example the sheep menu
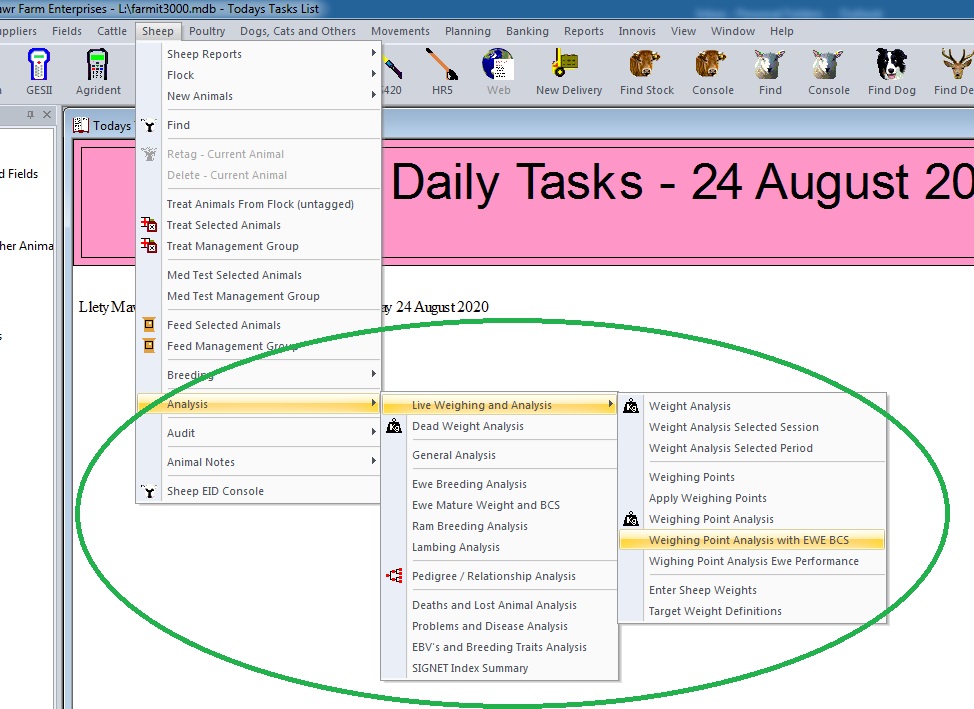
The following anaylsis views are currently provided.
Field Summary
Field Analysis
General Analysis
Dam Breeding Performance
Sire Breeding Performance
Cattle Calving Analysis
Lambing Analysis
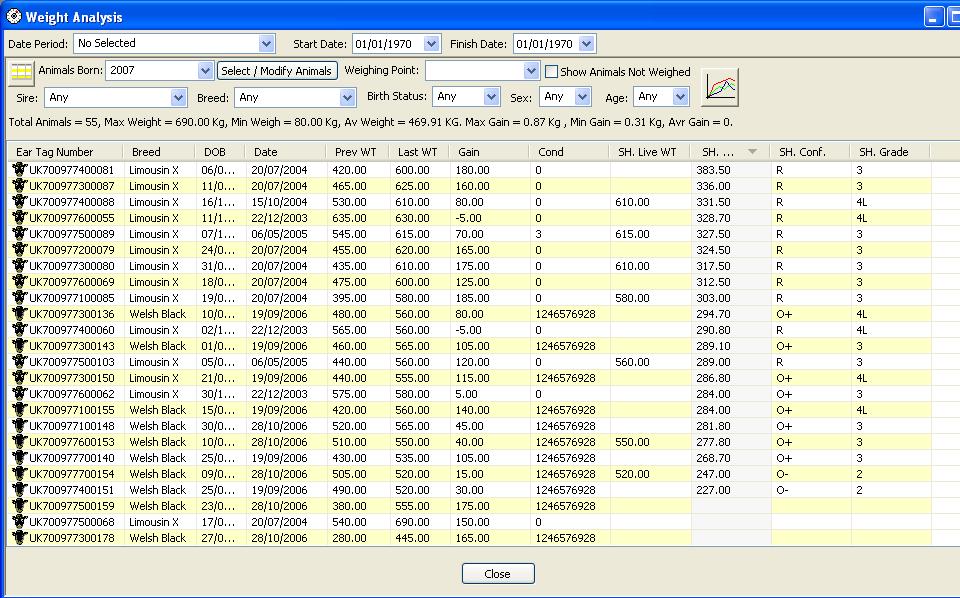
Weight Analysis
Dead Weight Analysis
Weighing Point Analysis
Weighing Point Ewe Performance
Pedigree Relationship Analysis
Problem and Disease Analysis
EBV and Breeding Trait Analysis
Milking Analysis (Dairy Module Only)
The data to be analysied is specifc to the analysis view but is normally selectable, i.e you pick a year for lambing analysis or a group of anaimals for weight analysis or a date range.The data is then displayed in column form with again appropreit columns relavant to the analysis, for example weight for weight data, ebvs for ebv analysis.
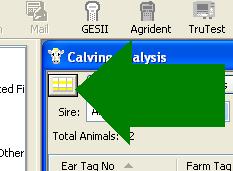
Selecting Only the columns you want
You may modify the select the columns you want to display by clicking on the column
selection button in the top left hand corner of the form.
 You are then displayed the list of available
columns associated with the analysis view.
You are then displayed the list of available
columns associated with the analysis view.
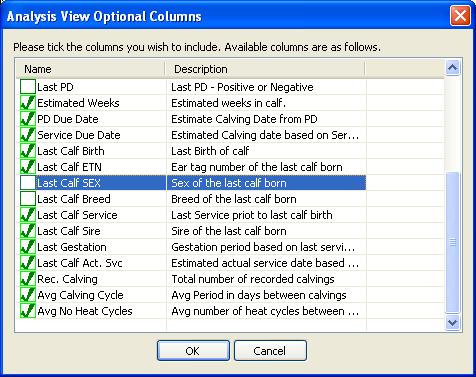
Simply tick the columns you wish to display, or untick those you do not want
to display. Then clickthe 'OK' button. Column selection is saved so the analysis view will look the same if you close it and reopen.
Sorting by columns
You may sort the data by simply clicking on a column heading, sorting
the data either ascending or descending. For example clicking the 'Last Wt' column headers will sort by the last weight. first up click again for down...Watch the scroll bar on the very right hand side as you may need to scrolllt otop or bottom.
Using the Filters
At the top of the analysis screen you will have relavant filters, for example BREED, SEX, AGE etc. These filters may be used to select animals appropriet to the filter, for examples of the same breed or sex. They may be used together in order to select animals that are a specific breed and a specific SEX.
Simplay changing the selection will automatically filter the data, selecting 'Any' will remove the filter
Clicking the list, left and right mouse buttons
The grid or list is also active in that you may use your mouse left button to open the subject by clicking on column one. For most animal analysis this is the ear tag number so left clicking column 1 will open the animal record.
The right mouse button is used to display the grid 'POP UP' menu. This is an additoinal menu of usefull commands to apply to the data. The menu is specifc to the analysis view but typically lets you perform operation or selections based on the 'Selected' animals in the list. This may include getting a list of the selected mothers or getting a list of progeny etc.
Selecting Records or Lines
You may select a line on the list by a simply single left click on the line (anywhere along the line). This turn the line blue (or highlight colour). Clicking another line will select that line and deselect the first. You may select multiple animals by either using the shift key (up arrow key) or the ctrl key
The 'Shift@ key allows you to select a number of line by clicking the top line whilst pressing shift, then keeping shift pressed select the bottom lin. This will highlight all the lines between the top and bottom.
The 'Ctrl' key (control) allaows you to select a line by clicking whilst pressing the trl key, then click another. You may select mutpli lines, just keep clicking. Release theCtrl key to stop.
Whether you use the shoft or Ctrl key you will end up with multiple selected lines
Creating or Adding To a Management Groups
Most analysis views have either a specific 'Add to Management Group' button at the top or a 'Add To Mgr Group' option on the popup menu. Select the animals as above , click the button or menu option, then select or create the management group.
Statistics
The statistics button (above the grid on the top left 'S' button) is avaliable on most analysis views. It provides statistical summary of the analysis data, for example lambing statistics or weight statistics. The statistics include the number of records , minimum and maximum values and average values. Where appropriet these are avaliable by breed, sex, sire etc
The statistics are generated fomr the 'Displayed' data, i.e the filtered data is not included in the statistic.
Exporting to Text/Excell
Analysis data may be exported to text file or Microsoft Excell. Only the displayed data is exported to filtered data or hidden columns are not exported. The export functions are on the main file menu (top left).
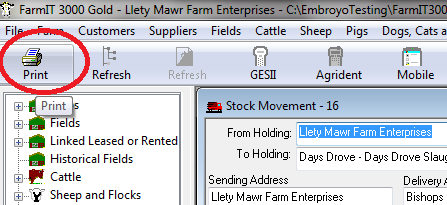
Printing
You may print the data from the list by clicking the system 'Print' button on the toolbar or using the 'Print' option and the file menu. The column width of the display is used for the width on the printout.