Analysing Weight Gain
Introduction
There are three main analysis tools (views) for weight gain and growth performance.
1. Weight Analysis
2. Weighing Point Analysis
3. Dead Weight Analysis
The views bring together the basic animal information with weigh records. All the views allow you to click on an ear tag number and go straight to the animal record. You may also filter the list of
animals and sort the list by columns. The Stats button ('s' JUST ABOVE THE EAR TAG NUMBER COLUMN) allows you to see a statistical summary of the data. You may also export the data to Microsoft
excel from the main file menu(top left).
Weight Analysis
The main tool is the weight analysis screen. We intend it to be used to review current / last weights of animals on farm or in a management group , by year of birth etc.
In order to identify current growth rates or gain for animals recently weighed.

The view contains many columns some of which you may not want or may not be relevant to you farm, you may select the columns using the column selection button in the top
left of the view. You may also click the column heading to sort the view by the column values and filter the list of animals based on the selection boxes at the top of the views.
This view also allows the analysis of animals by weight session or date, i.e you may look at animals weighed in a specific session. The session weight being used as the animals last weight.
You may therefore review performance up to the session weight.
The view limits weight to the first weight on farm, last weight and previous to last weight, therefore if an animal has been weight 8 times only weights 1, 7 and 8 will be used.
This view also includes a target weight and calculates the number of days remaining to reach the target weight.
 The Graph button in the top right and allows production of daily weight gain graphs, gain
between dates and weight distribution . Please see graphing below.
The Graph button in the top right and allows production of daily weight gain graphs, gain
between dates and weight distribution . Please see graphing below.
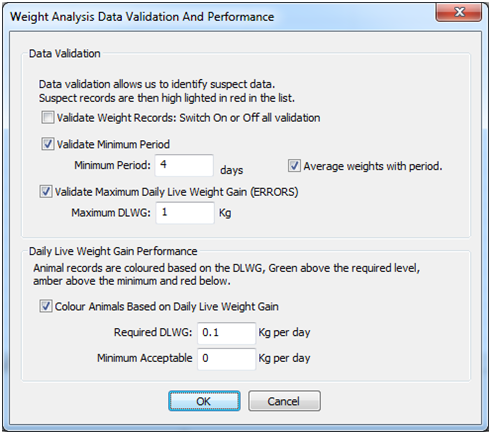
Validation, Averaging and Performance colours
The validation button allows you to enable or disable weight validation, averaging and performance.
Weighing Point Analysis
Weighing point analysis allows the analysis of weights adjusted based on DLWG to a specific day (Weighing Point), for example 300 Day Weight. It is specifically designed
for the analysis of growth rates between animals in order to identify differences in DAM performance, i.e milking etc.
You need to define the weighing points , but you do not need to do so before you weigh your animals, only prior to using the analysis tool.
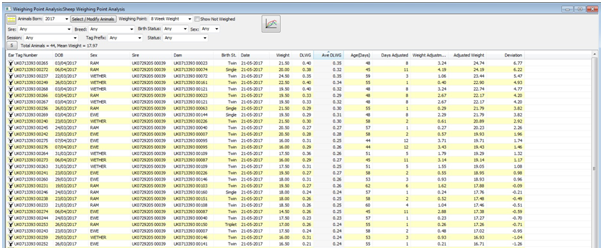
The average of the group is also calculated and the variation from this difference shown as the deviation from the mean. This effectively ranks the animals.
The calculations to achieve this are similar as those used to calculate an animal’s EBV, but do not take into account the performance of related animals.
You may define your own weighing points and the range of weights that may be used.
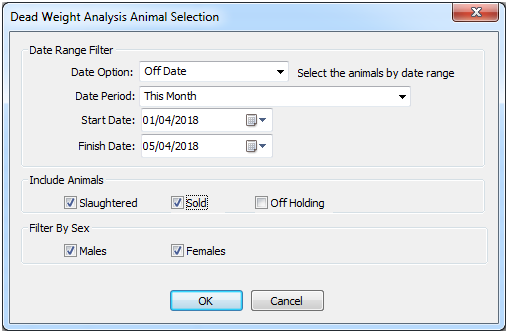
Dead Weight Analysis - (Slaughtered or sold)
Dead weight analysis is used to review overall performance on farm and includes first and last live weights and carcass weights if entered.
It also includes purchase and sale weights and may be used to review animal profitability and farm costs.
You may select animals based on dates to sale or slaughter..
The view contains menu columns, it also has filters etc like weight analysis, It also has colour options based on profit and loss, which you may configure using the options button.
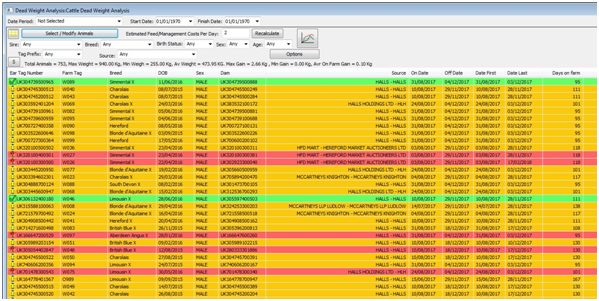
You can define a daily farm cost, from which farm cost may be estimated, you may even adjust this figure and see the effects on profit and loss. It should be noted that the animals farm
cost is primarily dependent on the feed cost and labour cost per day. VET and Med costs although
substantial are normally small compared to the feed and labour cost, as normally the animal is NOT treated every day.
For example if you treat all animals arriving on farm, in order to prevent disease then there is little you can do about the cost and every animal will basically have a very similar cost.
Animals that require a specific treatment for a problem are normally NOT growing therefore the profit will soon disappear.
If slaughter house data is recorded (imported) this is also displayed, kill out percentage is based on slaughtered dead and last live weight on farm. For this to be accurate you
should try to weigh animals within two - three days prior to slaughter.
Graphing Weights
Graphing the animal weights provides a very good way of analysing performance, and there are four main types of graph available.
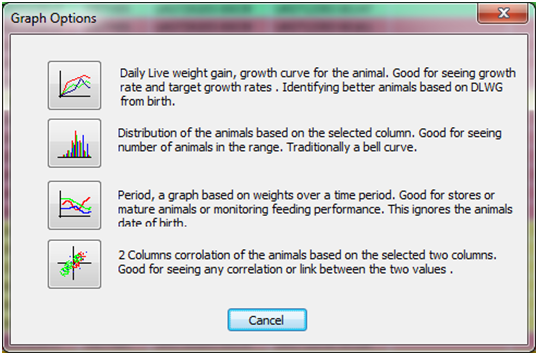
Daily Live Weight
Best graph for comparing multiple animal growth rates from birth to the select age in months, i.e 6 , 9 or 18 months. It colours the points based on selectable birth status and sex etc.
It includes weighing points and target weights. If Animals are not weighed at birth then the system default birth weight is used. The average of the grouped animals is also plotted and you may
click on a weight point to go straight to the animal.
Distribution
Bases on weighing points this graph shows the distribution of the weight about the mean value. For example 8 week Weights for lambs or 100 Days weights for cattle.
Period
This graph displays weight data based on the date and is best used for looking how groups of animals perform. It may be used to see changes in gain due to stock movement between dates or treatment dates.
2 Column Correlation
The most complex of the graph it enables us to see the correlation between two columns, i.e first weight and last weight, or breed and weight.
Target Weight Definitions
Target weights may be defined for cattle and sheep and you may have multiple targets. They are used primarily on the weight gain graphs and weight analysis.
Setting Target Weights For Cattle
From the mains menu select Cattle/Analysis/Live Weighing and Analysis/Target Weight Definitions
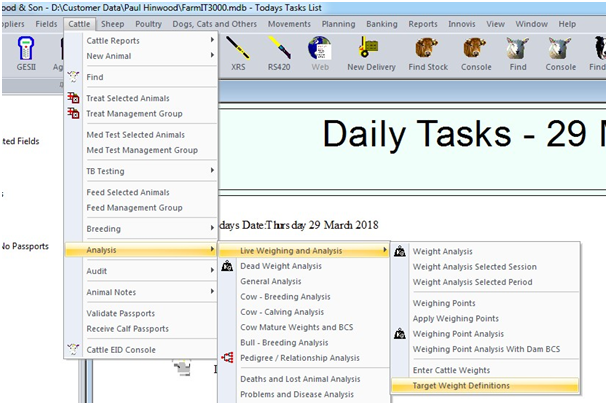
The list of defined target weights is then displayed....
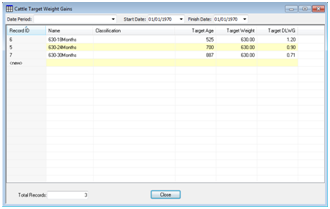
You can double click on the word ‘’ to create a new record or the record to modify one.
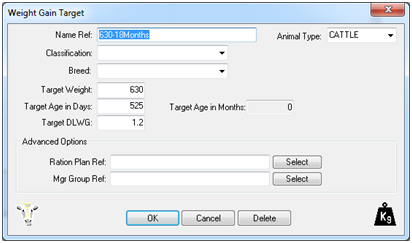
Name Ref
This is simply a name you can give the definition, they have to be unique. We would suggest they are also informative, May be 300Day or 12Month.
Animal Type:
This defines this target as being for cattle.
Classification and Breed
Setting these limits the target to specific types, i.e. Steer , Aberdeen Angus etc Leave these blank to apply the target to all animals.
Target Weight
Set the target weight first.
Then either set the Target Age in Days or the Target Daily Live weight gain (DLWG).
Target Age in days
Setting the target age in days will automatically update the age in months and then recalculate the daily live weight based on the target weight.
Target DLWG
Setting the target DLWG will automatically recalculate the age in days and months, based on the target weight divided by the DLWG.
The ration plan and management group options are currently not used but have been added for future use. These therefore may be ignored.
Weighing Points
Weighing points are used to analysis weight for animals by calculating the animals weight at a specific age in days. For example 56 days or 100 days.
The calculated weight is based on the animals DLWG from its previous weight to the weight closest to the target day. In order to be as accurate as
possible animals should be weighed as close as possible to the target day. Given it is quite unpractical to weigh every animal you have on the exact day the animals
reaches the weighing point, we define a range of days that we are happy with , this could be 30 – 50 days either side of the target.
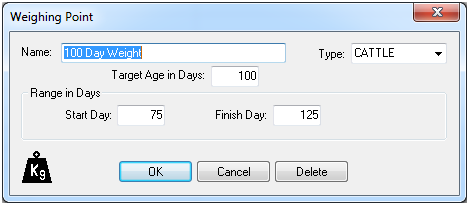
Name
Enter a name to describe the point , e.g. 100 Day Weight
Type
Animal type i.e. CATTLE
Target Age In Days
Enter the target age
Range in Days
Enter the start day and finish day to define the range from which weights will be taken. i.e. weights outside this window will not be
used as the weight to adjust. Any animal without a weight in the period will be excluded from the analysis.